
The report
What's in your report
Ten sections, each tied back to the mapping and records behind it. Below is what every one of them covers.
Your buying decision at a glance
The short version, up front. What the evidence supports, what still needs checking, and what could realistically stop the deal. One page, not ten.
The property, its access, and its zoning
The mapped boundaries, and whether the property has indicated road access based on the available records, not just a line that looks like one. Zoning standards (setbacks, height, coverage) are pulled directly from the municipal by-law text, along with whether your intended use appears to be a permitted one in that zone. Current legal zoning and access should still be confirmed in writing with the municipality before you rely on either.
Drinking water
Whether the property falls inside a municipal water service area, or is likely to need a well. Where a well is indicated, nearby well records (yield, depth) give you a reasonable starting expectation, not a guarantee of what your own well will produce.
Wastewater
A screening of whether the lot likely has enough usable space for a septic system, primary field and reserve area both, based on lot size and mapped constraints. This is one of the more common causes of a rural deal falling through, and it's worth having an early read on before your conditions come due.
Environment and buildable area
Mapped wetlands, watercourses, and coastline setbacks that reduce what's realistically buildable. A ten-acre lot with six mapped buildable acres is a meaningfully different purchase than the listing suggests, and this section shows you both numbers.
Terrain and topography maps
This is often the single most useful part of the report. Built from bare-earth LiDAR data at a 1 meter grid, the topographic map shows real contour lines and slope across the whole property, not a flat outline. It's the clearest way to see, before you ever set foot on the land, whether the building site you have in mind is workable or whether you're looking at real site prep costs.
Electricity
Distance to the nearest mapped power line and what kind of service it appears to be. Useful for getting an early sense of what a connection might involve, though actual cost and capacity should be confirmed with the utility.
What to do next
A checklist built around what this specific property flagged. Survey, title, water testing, whatever applies, to bring into your purchase conditions.
How this assessment was reached
Every rating in the report ties back to a specific written rule and the mapped evidence behind it. If a section reads "warning," you can see exactly what evidence and what rule produced it, rather than taking our word for it.
Report limits
An honest account of what mapping can and can't establish, and where a surveyor, lawyer, or engineer still needs to be the final word. We'd rather flag something as unknown than present a guess as a fact.
Four maps, every report
See the land before you stand on it
Four maps come with every report, and for a lot of buyers, this is the part that ends up mattering most. A property plan lays out the parcel itself, with approximate boundary dimensions, contour lines, and any mapped buildings or roads. An aerial view puts the property in context with what's actually around it. A constraints map lays wetlands, watercourses, and setback lines directly over the parcel boundary, so you can see at a glance what's really buildable and what isn't. And a topographic map, built from bare-earth LiDAR data at a 1 meter grid, shows real contour lines and slope across the whole property, not a flat outline on a survey plan.
If you can't get out to walk the land yourself before your conditions come due, this is the closest thing to seeing it in person. You'll know where it's flat, where it's steep, and where the buildable area actually sits, before you decide whether to waive your conditions and move to closing.
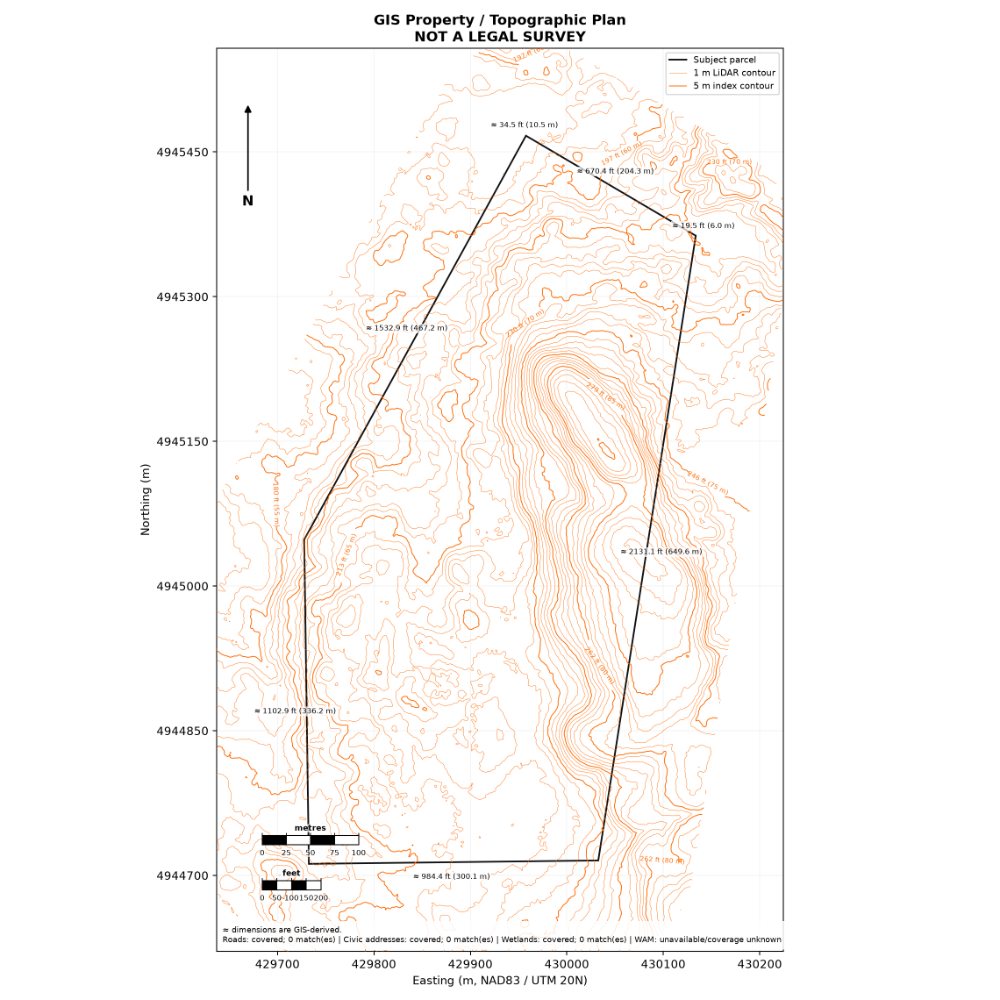 Property plan
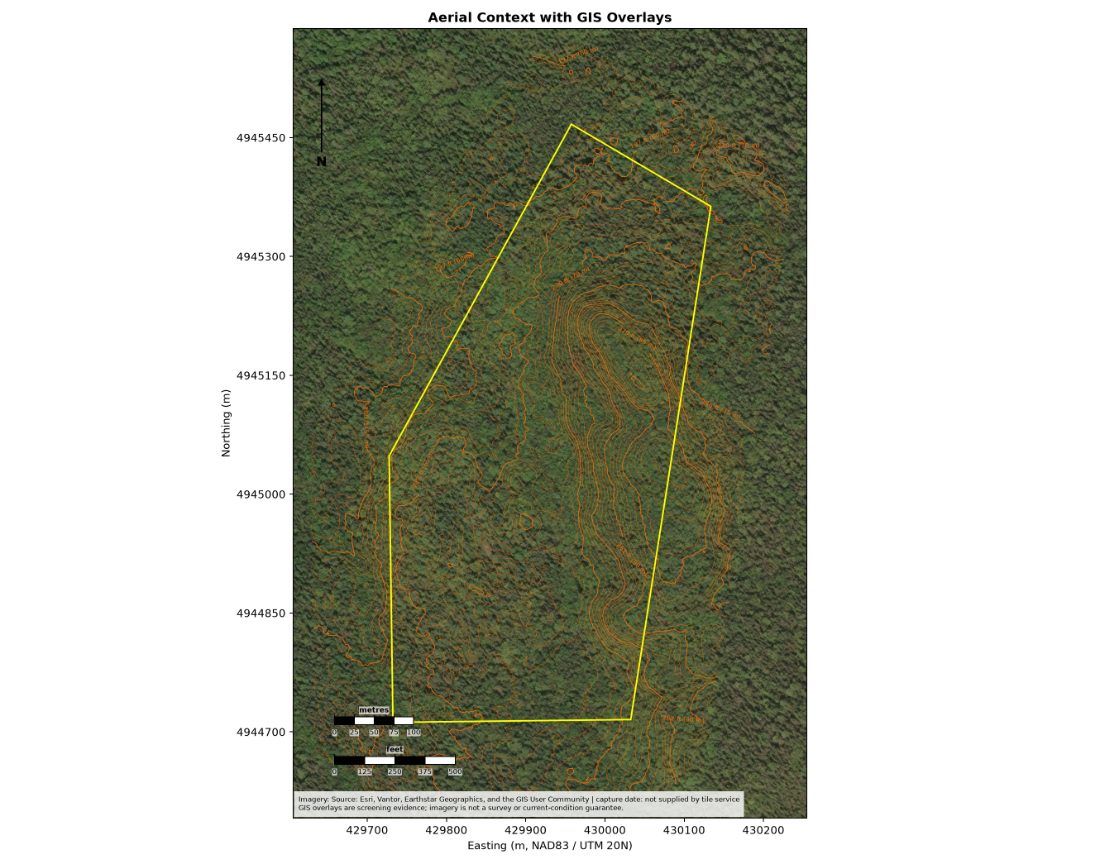 Aerial context
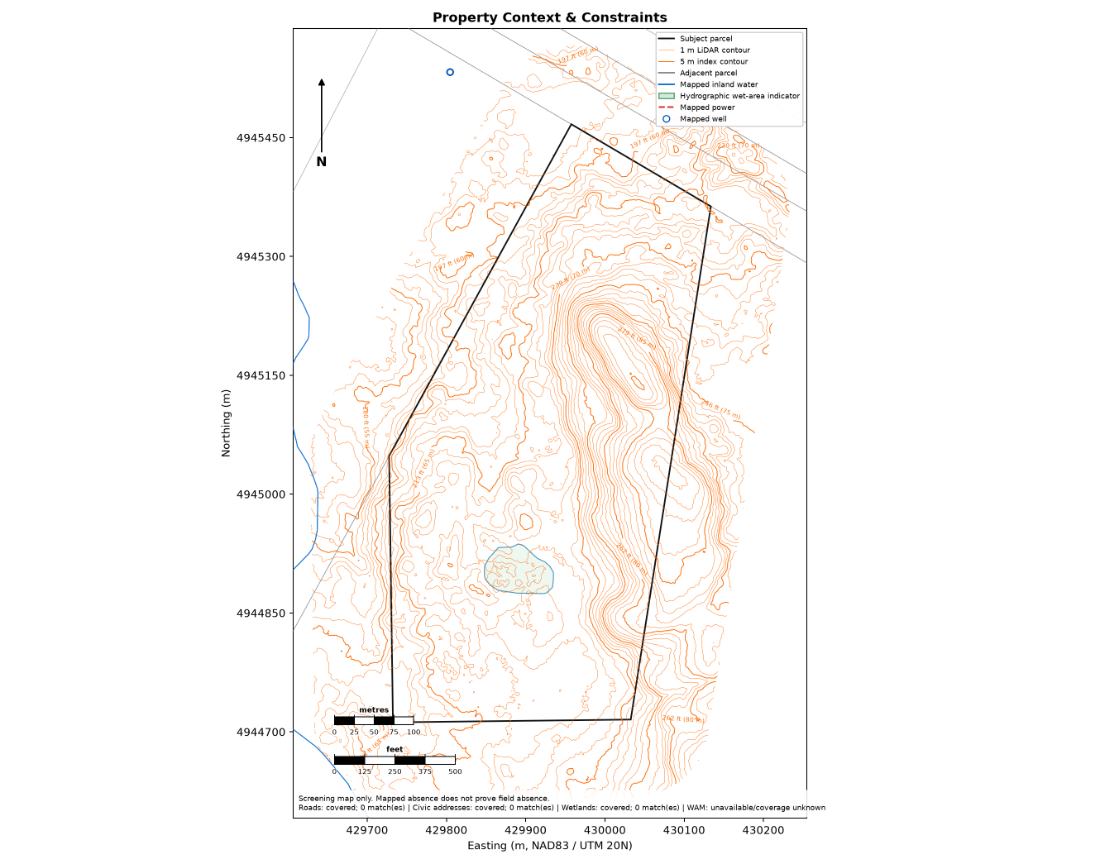 Context and constraints
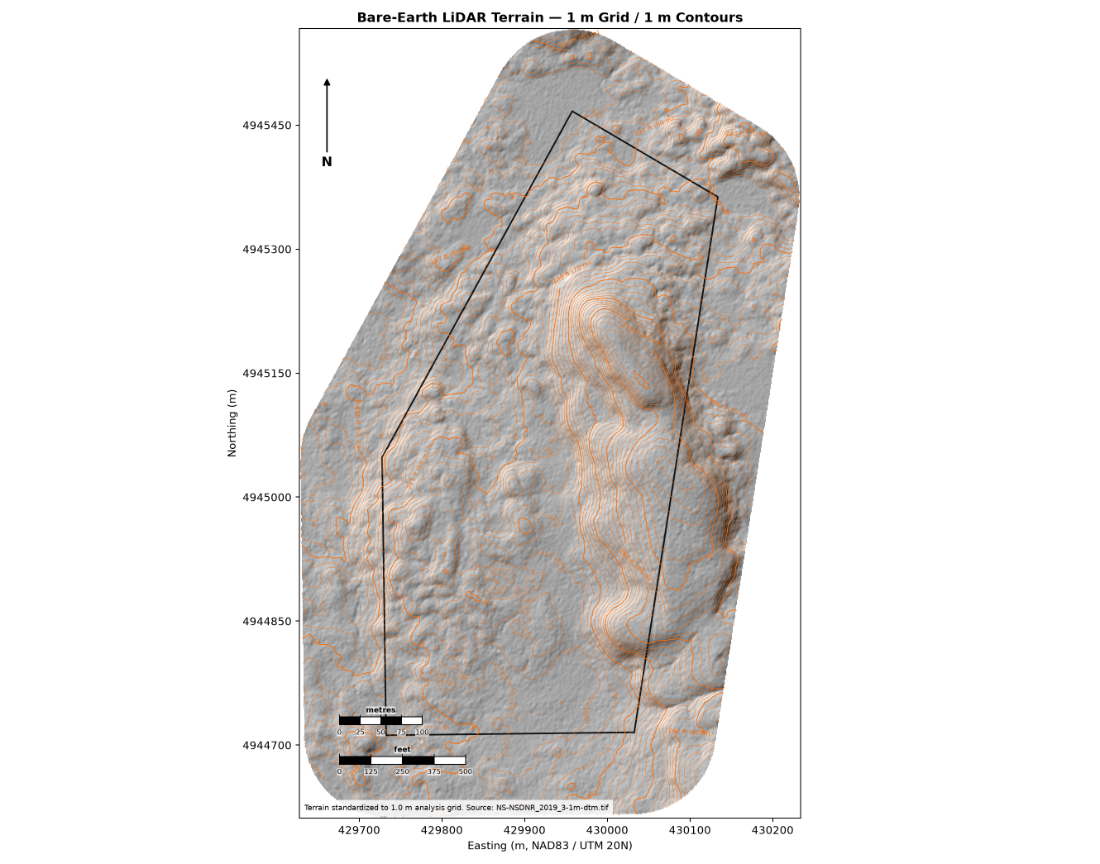 Bare-earth terrain
In person
Walking the property
Mapping and public records can tell you a great deal, but they can't tell you everything, and we don't pretend otherwise. As part of the process, we go out and walk the property in person, to check that what's actually on the ground matches what the report and the mapping show. That includes looking for signs of fill or disturbed soil that wouldn't show up in any GIS layer but could affect what you're able to build, checking for wetlands or wet areas that aren't captured on the official mapping (which happens more often than people expect, especially on smaller or less-studied parcels), and flagging any property pins we're able to locate on site, where applicable.
No amount of records and mapping is a perfect substitute for standing on the land itself, and we won't tell you it is. What this process gives you is the same thing a thorough walkthrough gives a buyer in any other kind of purchase: a second, in-person check against everything the paperwork says, so your decision is based on the property as it actually is, not just as it's recorded.
Read a complete sample report
The full Level 1 report for a real parcel, start to finish, so you can see exactly what arrives.